Why does console.log hate me?
Have you ever felt like console.log hates you? If yes or you just want to know a bit more about its quirks, have a quick read!

Lately, I’ve started to address some hate over those “don’t use console.logs” online posts. This is because the title sends people entirely off track and the expectations of what’s written in the post ruin people’s minds.
These posts usually want to:
1. Learn how to use the integrated debugger (being it chrome’s or vs code’s one for example).
2. Tell you that there are smarter ways to print things in the console with libraries that allow you to differentiate logs priorities, switch debugging levels with an env var, and so on and so forth.
First of all, it doesn’t make sense to place a breakpoint just to read some value in our code, it’d be like using a neural network to perform a simple sum (I’m being ironic now). Secondly, even if you use a logging library (which is a good thing by the way), you still need to know the basics since, even a library, will and must use the window.console object (at least for front-end code, but the concept applies everywhere).
So both of these things are definitely implying that you will still eventually print something, somewhere, somehow.
Warning ahead
Some of the content I’ll be showing you is implementation-defined and therefore highly tied to the browser you generally use. I’m a heavy Chrome user, but I’ve also done some tests over Safari and they don’t change much.
You do your own, and make sure to tag me on Twitter @giacomocerquone 😁
What’s the matter with console.log?
Have you ever tried to print a DOM node? Or an error? Or a regular expression? If the answer is yes, you surely noticed that something was off. Many people believe that console.log prints a serialized value (that is, the value converted into a string).
The reality though is different. Browsers can decide by themselves how to print certain values.
Following the console specifications, how an object it’s printed, for example, is implementation-defined.
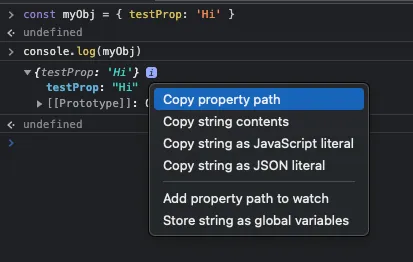
In fact, I’m sure you’re more than used to printing objects and we don’t just observe a stringified version of it. We can actually navigate it, copy the path’s properties, store the object globally, and so on:
What about printed errors? Ouch, I’ve lost so much time reading the documentation of many data-fetching libraries just to understand how to retrieve some other information about the error. Why so?
Try to print an Axios error with console.log, for instance (or any error really):
What you’ll see is a representation built by the browser that prints the “message” and “stack” properties of the error object.
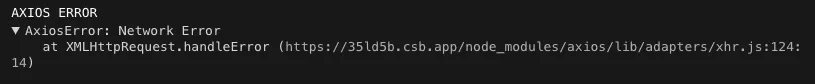
This is the error printed through console.log
And how do I inspect all the other properties instead? (if there are any)
With console.dir.
Just call it with just one parameter which would be the error object, and nothing else. It doesn’t support strings, and you don’t actually need them. (Make sure to check out the TLDR section on this.)
In CodeSandbox, make sure to open the real chrome dev tools of the iframed preview, otherwise, the integrated console right now doesn’t support console.dir.
In Safari instead, logging an error with console.log or console.dir doesn’t make any difference but logging an object with dir let you inspect also the prototype and gives you type hints over the properties 🤦
TLDR;
- Whatever the browser, use
console.dirwhen you want to inspect objects (that includes errors, regexp, dom nodes, etc.). - For everything else use
console.log - Either you use
console.logorconsole.dir, don’t mark your logs with strings such asconsole.log('myVar', myVar)(which is not even supported with .dir), but just wrap the data within an object like so 👉console.dir({myVar})
Other quirks?
I think there is actually another interesting thing to talk about when inspecting the console’s behavior. It can be summarized into the following question:
I print a value at time “t”. At “t+1” the value is changed, what value do you expect to see?
The intuitive answer would be that we’ll see the initial value and not the changed one.
Sadly, this is not the case with mutated values. When you print an object’s reference (what’s that?) and then the object is mutated, chances are (depending on the browser you’re on) that you see the mutated value and not the original one.
Is this because the console is asynchronous?
No, not at all. That has nothing to do with it and we actually can’t know (neither it matters) if our log calls are async or not (I suggest you read this).
The actual reason is simpler. Basically, the console tries to keep up with the modifications applied to the object pointed by the reference.
Let’s play out with an example (once again CodeSandbox’s console doesn’t support this):
Don’t get tricked though
In Chrome, there is a little bug in the live-view mechanism. Look at this screenshot:
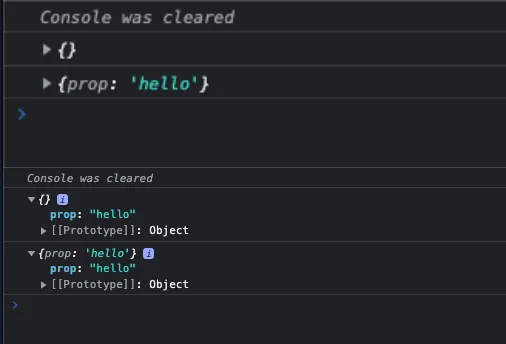
The first log is the mutated object, while the second one was left untouched throughout the life of the application. If you notice at the first piece of the screen where the objects aren’t expanded yet, you’ll see how it seems empty.
Has this ever occurred to you?
Do I need to solve this?
It depends. If you’re used to working with libraries and frameworks bound to immutable data structures, such as React, chances are that you will not encounter these issues much (unless you’re dealing with refs). But in other environments, you might.
So a solution you can put in place, also illustrated by MDN, is to use JSON.parse(JSON.stringify(myObj)).
The same applies to console.dir.
That’s it
Enough with the quirky stuff today.
Enjoy the week and rock at your workplace 🚀