Debug web apps running on native mobile devices
Sometimes bugs can only be reproduced in the specific environment they are discovered. What if they're found on an Android or iOS device?

If you work in a field where web apps need to support many browsers or even if your company doesn’t have a native app and mobile users just use the website, you probably know the difficulty of debugging issues that happen on different platforms.
I imagine many of you are used to opening up the responsive dev tool of your desktop browser among many other things, for example, to inspect the responsiveness of the UI. But are there issues happening only on mobile that we can’t reproduce just by using the responsive feature of the DevTools?
Buckle up in this brief journey of cross-platform native debugging 🧑🏻🚀🚀
Native mobile web issues
A certain number of issues are specific to the browsers running on mobile environments. A recent one I tackled, for example, was a race condition happening between an animation and the triggering of the keyboard due to an autofocused input. Another one I dealt with in the past was the manual focusing of an input that on Safari iOS wasn’t triggering the keyboard’s opening. The same goes if your app access native capabilities such as location or media files and so on.
So how can we inspect the web app while it’s running on a device?
As always there are exceptions with Apple since they’re used to doing things in their own way 🤐
Let’s start with the easiest one.
Android
First of all, connect the smartphone with a USB cable, then enable USB debugging on your smartphone and fire up your chrome-based browser (yes, Microsoft Edge is fine too), and visit the following link:
chrome://inspect/#devices
Now if you’re sure Google Chrome is opened on your smartphone, you should be able to see it in the list together with all the pages opened on that browser instance even though it can take some time to display the connected devices.
Clicking on “inspect”, the DevTools opens up, and keep in mind that only if you have Chrome in the foreground on your smartphone, you will be able to see a live stream of your web app’s UI that you can click and interact with.
Wireless
There is also a way to activate wireless ADB debug, but since you need to pair the device with your laptop, certain ADB commands have to be launched from the terminal (you can find a guide on this medium post if you’re really interested).
iOS
Here comes the bad part.
Have you ever noticed that every browser downloaded from the AppStore on Apple devices looks pretty similar? That’s because Apple forces companies to use WebKit as the sole browser engine and this brings many implications, one of which is the way we can debug websites running on iOS devices from our PCs.
Put very simply, you cannot debug any website without having a mac, so even if you have installed Chrome on your iPhone, you can’t connect to the browser in the same way you’d do it on Android. There is a, paid, way though that we’ll talk about later.
If you instead happen to have a mac, make sure to have the “inspector web” toggle enabled within the “Settings -> Safari -> Advanced” section in your iOS device.
Connect via USB your smartphone, open Safari on both your mac and iOS device (here just make sure to open at least a page to inspect) and then on your mac go on “Development” and choose your iPhone:
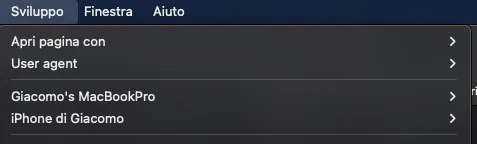
Finally, you should see a list of tabs opened on your device, whenever you click on one, the dev tools open up.
Remember that on iOS too, Safarineeds to stay in foreground with the device unlocked to be able to debug the pages.
Wireless
Here the wireless option is much easier than on Android. When you arrived at the above step, select your iPhone and click on “Connect via network”.
This will bind your device to your mac through the wifi. Make sure you don’t have the iOS device locked, otherwise it can disappear completely from the list.
Chrome iOS
Regarding Chrome iOS, things get much more difficult to debug. Let me start with a little tip:
When using Chrome on mobile iOS you can activate logging just by opening this link directly from your iOS device:
chrome://inspect
Then tap on “start logging”, put the tab in the background, and perform the activities you want to log in new tabs. This isn’t definitely enough, but it’s something.

The solution to all of the problems
Since you arrived so far reading the post, I imagine you also want to know how to properly debug a web app running on an iOS device from windows even if the device’s browser would be Chrome mobile. Let me start by saying that being the same engine as Safari, it’s very rare to find issues on Chrome alone (this is to say that you could simply use safari to debug your web app). But let’s explore the options together.
Google released in the following repository a proxy that works on Linux, Mac, and Windows and it’s able “to send commands to MobileSafari and UIWebViews on real and simulated iOS devices”. This proxy alone isn’t very usable with standard dev tools (either they have to be recompiled or older versions should be used), for this reason, this other project was born.
It’s a TypeScript project that spawns google’s proxy, creates an adapter that is compliant with the chrome dev tools protocol and sends the adapted commands from the dev tools to the proxy. There is a very interesting post published by the creator of the package that explains a bit about the mechanisms.
The bad news is: it became a paid project (which works very well though) called inspect, which allows us to debug any web app on any device (both Android and iOS).
That’s it
Remember that the more you improve your debugging skills and tools, the faster you’ll be able to solve issues effectively over time.